Decision-making is the final stage of the inspection process and is a key aspect of your business.
The vast quantity of data from captures in a natural (uncontrolled) environment is processed by our algorithmic and machine learning tools. The quality of results is controlled throughout the process to ensure that we provide you with relevant and qualified information. Autrement dit, nous mettons à votre disposition l’information pertinente et qualifiée. The human expert, with their unique knowledge of the intricacies of their profession, simply needs to validate or reject the decisions made by our applications.
We make our decision support tools as easy to understand as possible. Reliability is qualified through our expertise in the entire data processing chain – to enable you to make an informed decision.
Once made, your decision strengthens the learning tools, enhancing their long-term performance.
Would you like to connect your tools to our systems for direct integration based on your needs?
Our software components allow us to design your processing chain as a gradual interpretation process. For us, there is no conceptual difference between the measurement and the model – only the degree of interpretation changes.
We model cascades of functions that take Representations as input and return Interpretations as output.
Representation and Interpretation are therefore two related concepts. The difficulty of your application depends on two characteristics arising from this connection: its complexity and its complication…
Our decision support know-how
Libraries of blank and/or pre-trained components
Design and implementation of indicators tailored to your application
History management
Integration into your workflow
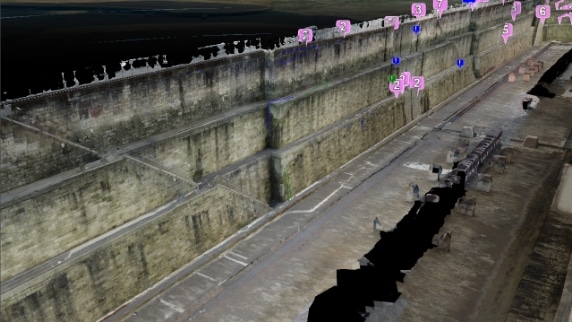
Visualisation
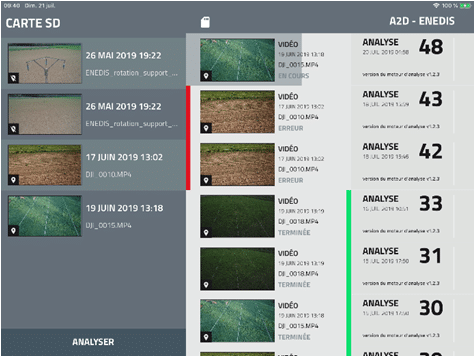
Business information extracted from raw data allows you to focus on the essential, facilitating rapid and objective decision-making.
Grouped on a single screen and divided between different graphical elements, the indicators we have designed with our partners form an ergonomic and interactive dashboard.
Connected to our databases and decision-making tools, you see the result of your queries in real-time, along with trends in the condition of your structures.
From internal teams to service providers and partners, this dashboard allows all stakeholders to view and act on the same data, depending on the permissions assigned to them. This significantly improves communication between all parties involved.